
|
Research |
|
Although BOLD fMRI provides a useful tool for probing neuronal activities, large inter-subject variations in signal amplitude are commonly observed. Understanding the physiologic basis for these variations will have a significant impact on many fMRI studies. First, the physiologic modulator can be used as a regressor to reduce variations across subjects, thereby improving statistical power for detecting group differences. Second, if a pathologic condition or a drug treatment is shown to change fMRI responses, monitoring this modulatory parameter is useful in correctly interpreting the fMRI changes to neuronal deficits/recruitments. We present evidence that the task-evoked fMRI signals are modulated by baseline blood oxygenation. To measure global blood oxygenation, we used a recently developed technique, T2-Relaxation-Under-Spin-Tagging MRI, yielding baseline oxygenation of 63.7±7.2% in sagittal sinus with an estimation error of 1.3%. It was found that individuals with higher baseline oxygenation tend to have a smaller fMRI signal and vice versa. For every 10% difference in baseline oxygenation across subjects, the BOLD and cerebral blood flow signal differ by -0.4% and -30.0%, respectively, when using visual stimulation. TRUST MRI is a useful measurement for fMRI studies to control for the modulatory effects of baseline oxygenation that are unique to each subject. Next, we aim to test the utility of venous oxygenation normalization in distinguishing subject groups. A “model” condition was used in which two visual stimuli with different flashing frequencies were used to stimulate two subject groups, respectively, thereby simulating the situation of control and patient groups. It was found that visual-evoked BOLD signal is significantly correlated with baseline venous T2 (p=0.0003) and inclusion of physiologic modulator in the regression analysis can substantially reduce p values of group-level statistical tests. When applied to voxel-wise analysis, the normalization process can allow the detection of more significant voxels. The utility of other basal parameters, including blood pressure, heart rate, arterial oxygenation and end-tidal CO2, in BOLD normalization was also assessed and it was found that the improvement was less significant. Time-to-peak of the BOLD responses was also studied and it was found that subjects with higher basal venous oxygenation tend to have slower BOLD responses. |
|
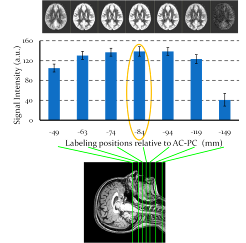
Pseudo-Continuous Arterial Spin Labeling (pCASL) MRI is a new ASL technique that has the potential of combining advantages of Continuous-ASL and Pulsed-ASL. However, unlike CASL, the labeling process of pCASL is not strictly an adiabatic inversion and the efficiency of labeling may be subject-specific. Here three experiments were performed to study the labeling efficiency in pCASL MRI. First, the optimal labeling position was determined empirically to be 84 mm below Anterior-Commissure Posterior-Commissure line in order to achieve the highest sensitivity. Second, an experimental method was developed to utilize phase-contrast MRI as a normalization factor and to estimate the labeling efficiency in vivo, which was founded to be 0.86±0.06 (n=10, mean±SD). Third, we compared the labeling efficiency of pCASL MRI under normocapnic and hypercapnic (inhalation of 5% CO2) conditions, and showed that a higher flow velocity in the feeding arteries resulted in a reduction in the labeling efficiency. In summary, our results suggest that labeling efficiency is a critical parameter in pCASL MRI not only in terms of achieving highest sensitivity but also in quantification of absolute CBF in ml/min/100g. We propose that the labeling efficiency should be estimated using phase-contrast MRI on a subject-specific and physiologic-condition-specific basis. |
|
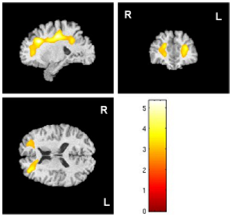
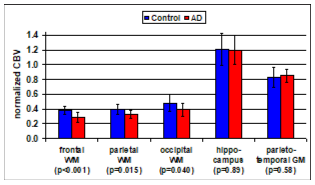
A vascular component is increasingly recognized as important in Alzheimer’s Disease (AD). We measured cerebral blood volume (CBV) in patients with probable AD or Mild Cognitive Impairment (MCI) (n=16, 9M, 7F, age=70.7±9.3) and in elderly non-demented subjects (n=10, 3M, 7F, age=73.1±4.4) using a recently developed Vascular-Space-Occupancy (VASO) MRI technique. While both gray and white matters were examined, significant CBV deficit regions were primarily located in white matter, specifically in frontal and parietal lobes, in which CBV was reduced by 20% in the AD/MCI group. The regions with CBV deficit also showed reduced tissue structural integrity as indicated by increased apparent diffusion coefficients, whereas in regions without CBV deficits no such correlation was found. |
|
1. Normalization of functional MRI signals |
|
4. Measurement of blood volume in brain and spinal cord
|
|
5. Development and application of Arterial Spin Labeling MRI in human brain disorders
|
|
3. Cerebrovascular dysfunction in aging and Alzheimer’s Disease
|
|
2. Modulation of brain activity by control of inspired air
|
|
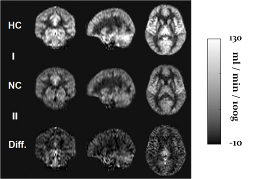
Alzheimer’s disease (AD) is a neurodegenerative disease that affects more than 4 million people in the US alone. To date, efforts at understanding the disease process have been primarily directed towards studies of amyloid accumulation and cerebral blood flow (CBF) deficits. Despite consistent findings of temporopariental hypoperfusion in patients with AD, there is a possibility that reduction in CBF may not be an indication of vascular dysfunction, but may merely reflect a reduction in metabolic demand. In our lab, we seek to clarify this by using a more direct approach to assess vascular function (the vasodilatory capacity of vessels) in AD. We applied BOLD fMRI under hypercapnia (5% CO2 breathing) challenge to measure cerebrovascular reactivity (CVR) in a group of AD and normal control (NC) subjects. Baseline CBF was determined using pseudo-continuous arterial spin labeling (PCASL) technique. Spatial patterns of CVR and CBF deficits were compared. We found that regions of CVR deficits were restricted to anterior regions of the brain. This spatial pattern is drastically different from the patterns of CBF deficit measured in the same groups, which showed predominantly temporoparietal regions. Thus, CVR may be a better marker of vascular dysfunction. In the future, we hope to further investigate vascular dysfunction systematically in AD so that we can achieve a better understanding of the disease process.
|

|
Figure: Averaged relative CVR (left) and CBF (right) maps for AD (top) and NC (bottom). AD showed CVR deficits in frontal and CBF deficits in parietal regions. These regions are indicated by yellow arrows |
|
Figure: Left) Results of voxel-based analysis with two sample t-test on the CBV maps of AD/MCI and control groups. The colored regions show significant CBV deficit in AD/MCI patients (p<0.005 and minimum cluster size = 1250 mm3). The color bar indicates Student t-statistic value. Right) ROI analysis results of CBV in AD/MCI and control groups. 8-mm (frontal, parietal, and occipital WM, hippocampus) or 6-mm (parietotemporal GM) diameter circles were drawn on each subject’s normalized CBV maps to obtain the mean value for each ROI. |
|
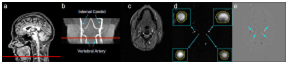
Figure: Left) Intensity of CBF-weighted signal as a function of labeling position. Top Right) Phase-contrast (PC) MRI of Internal Carotid Arteries (ICA) and Vertebral Arteries (VA). (a) Location of the slice of PC MRI on a mid-sagittal image. (b) Location of the PC MRI on the angiogram. (c) Raw image of PC MRI. (d) Magnitude image of PC MRI. The insets show the left and right ICAs and VAs as well as the manually drawn ROIs. (e) Velocity map from the PC MRI. Bottom Right) Average CBF maps during normocapnia and hypercapnia as well their differences. |
|
Russell H. Morgan Department of Radiology |
|
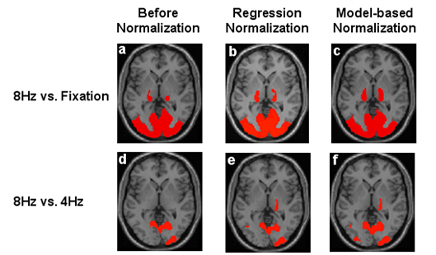
Figure: Group-level activation maps with un-normalized and normalized fMRI signals. (a-c) Activation maps comparing 8Hz flashing checkerboard and fixation (n=10). Threshold: p value < 0.005, cluster > 800 mm3. (c-d) Difference maps comparing two subject groups receiving 8Hz (n=10) and 4Hz (n=10) stimulus, respectively. Threshold: p value < 0.05, cluster > 800 mm3. Results from two normalization approaches, a regression based and a model-based, are presented. Only activations in thalamus and occipital lobes are shown. |
|
Non-invasively studying whole brain activity is the advantage of MRI technique. We try to utilize this advanced technique to investigate brain tissue and vascular physiology under inspired air modulation. For instance, 5% CO2 and 21% O2 which is noted as hypercapnia has notable effect on blood flow increase. Whether the brain activity is dependent on CO2 level is a more interesting topic in clinic application. The conventional brain functional MRI (fMRI) technique is blood oxygen level dependent (BOLD) MRI is not optimal to apply in hypercapnia study because BOLD contrast comes from neuro-vascular coupling mechanism which is disturbed by CO2 inhalation. We developed a technique (TRUST MRI combined with Phase Contrast MRI) to estimate absolute global cerebral metabolic rate of oxygen (CMRO2), a measure closely related to neural activity but insolated from vascular effect’s contamination. |
|
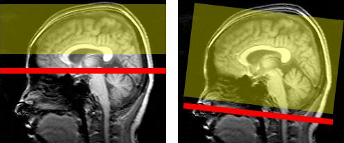
Fig. 2: Imaing Slice (in red) and labeling slab (in yellow) positions. Saggital Sinus TRUST is positioned on medial saggital survey. |
|
Hanzhang Lu Lab |